Goal
Make it painless to turn raw spreadsheets into clean, structured data and give users quick visual feedback.
What it does
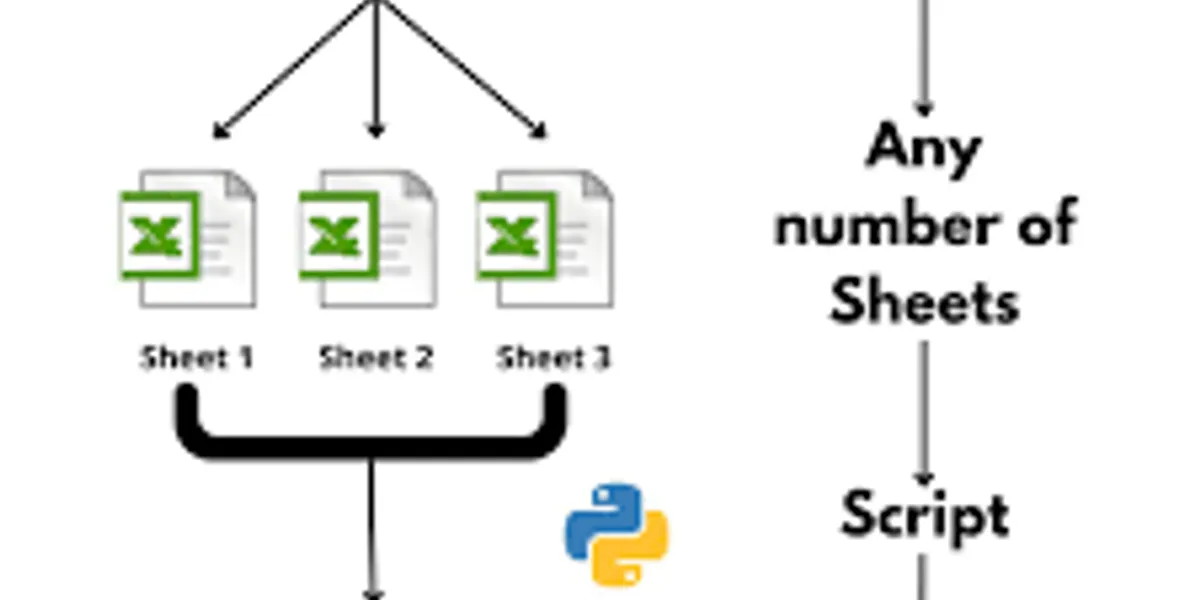
- Upload an Excel file → API cleans & normalizes rows/columns
- Download a processed .xlsx or view JSON
- Preview data in a spreadsheet-like grid (sorting/filtering/pagination)
- Quick demo charts (totals by region/customer) for sanity checks
Stack & architecture
- Front-end: React + Vite, AG Grid for spreadsheet UI, Recharts for demos
- API (planned/used): FastAPI + Pandas/Polars for transforms, tasks via Celery (optional)
- Build/Deploy: Vite static build, Netlify hosting (this demo)
Why it matters
Teams spend hours cleaning spreadsheets. This tool standardizes that flow and gives a fast loop for validating output before handing data off to analytics, CRM, or downstream automations.
Notes
- The deployed demo runs in sample mode out of the box.
- Real pipelines plug into FastAPI + Pandas/Polars and can export to Excel/CSV/JSON, or push into dashboards and reports.